Headless Compression Screw Fixation of Scaphoid Fractures
Janice J. He, MD, Kristen Kuo, BA, Ariana N. Mora, BA, Brandon E. Earp, MD, Philip E. Blazar, MD
The authors report no conflict of interest related to this work.
©2020 by The Orthopaedic Journal at Harvard Medical School
BACKGROUND Headless compression screws are the most popular type of fixation used for scaphoid fractures. Two commonly used implants are the Acutrak Headless Compression Screw System (Acumed, Hillsboro, OR) and Synthes Headless Compression Screw (Depuy Synthes, Raynham, MA). We hypothesize that the two implants will have similar odds of union and time to union.
METHODS We retrospectively reviewed all operative scaphoid fractures within a 13-year period (2002-2015) at three hospitals. Demographic and clinical information were recorded. Post-operative radiographs were reviewed by two board-certified hand surgeons for consensus ratings on radiographic union.
RESULTS There were 101 scaphoid fractures and non-unions treated with Synthes or Acutrak screws, with minimum 42 day follow-up. Of the acute fractures, 19 of 28 utilizing Synthes screws united in 67 ± 40 days and 16 of 28 utilizing Acutrak screws achieved union at 112 ± 121 days. Of the non-unions, 6 of 17 utilizing Synthes screws united for a mean time to union of 101 ± 43 days and 11 of 28 utilizing Acutrak screws united for a mean of 153 ± 123 days. The odds of achieving union did not differ between the two groups when controlling for confounders for both primary fixation (P=0.62) or nonunion (P=0.92). The time to union was not significantly different between the two groups for primary fixation (P=0.53) and nonunion (P=0.78).
CONCLUSION Implant choice does not create a difference in radiographic union. Surgeons should choose implants based on comfort with the instrumentation, availability and cost.
LEVEL OF EVIDENCE Level IV Therapeutic Study
KEYWORDSScaphoid fracture; scaphoid non-union; open reduction and internal fixation; implant choice; headless compression screw; clinical outcomes
The scaphoid is the most commonly fractured bone in the carpus.1 A sizeable subset of these patients develop non-union, theoretically due to the tenuous vascular supply of the scaphoid.2 A complimentary explanation to this phenomenon focuses on the biomechanical stability of the fracture, which implies a potentially sizeable role for surgical fixation.3,4 Scaphoid non-unions have the potential to cause very significant morbidity as they can lead to degenerative disease, deformity, and chronic wrist pain.5 These fractures are typically operated on to increase their probability of union. Even in cases of surgical fixation, scaphoid fractures frequently require a prolonged period of time to heal and/or necessitate revision surgery.
In the pediatric population, surgical implant type has been shown to have a statistically significant effect on rate of union and the time to union.6 Implant design has also been shown to affect union rates in scaphoid nonunions.7 The primary goal of this study is to address if the type of surgical implant used affects the rate of union. Two of the most commonly used implants are the Synthes Headless Compression Screw (Depuy Synthes, Raynham, MA) and the Acutrak Headless Compression Screw (Acumed, Hillsboro, OR). The Synthes screw is partially threaded and uses threads of different pitch on the head and shaft to achieve compression as the head engages with the bone. The Acutrak screw is fully threaded and compresses due to a graduated change in pitch throughout the entire screw. We hypothesize that although they utilize different methods for achieving compression, that the two will have similar rates of union and time to union.
All operative scaphoid fractures and non-unions from 2003-2015 in our health care system, which includes two large high volume academic medical centers and an associated community medical center, were identified via our comprehensive fracture billing database. Among these, those with other ipsilateral upper extremity injuries, including perilunate or lunate dislocations, were excluded. We retrospectively reviewed the remaining patients, identifying: patient sex, hand dominance, occupation, BMI, smoking status, history of diabetes, time of injury to treatment, operative treatment and type of implant used. Preoperative radiographs were examined to identify fracture pattern.
Post-operative imaging including: PA, lateral and scaphoid view of the wrist from each post-operative clinic visit was then collected into de-identified, randomly ordered slide decks. These radiographs were reviewed by two hand fellowship trained senior surgeons who determined by consensus whether the patient had achieved radiographic union. Each surgeon was blinded to the identity of the patient, the performing surgeon, and the time post-op when the radiograph was taken. Union was defined as 50% bridging trabeculae on multiple views without evidence of implant loosening.6 CT scans were not used for assessment.
The primary results of the study were defined radiographic union, non-union at six months post-operatively, or revision surgery. With these data, we constructed a multivariable logistic regression model looking at the primary outcome of non-union while controlling for variables related to patient and clinical factors. Additionally, we constructed a multivariate regression looking at time to union, while controlling for these same factors. Data analysis carried out using StataIC 15 (StataCorp, College Station, Texas).
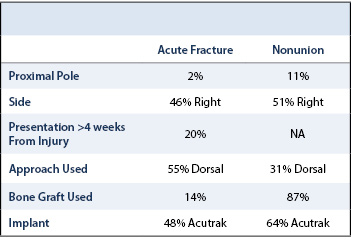
A total of 208 cases of fixation of acute scaphoid fractures and fixation for scaphoid non-unions in adult patients, by seven different surgeons, were identified and 147 of those were isolated scaphoid injuries. Of these, 101 were fixed using either the Acutrak Headless Compression Screw System (Acumed, Hillsboro, Oregon) or the Synthes 3.0 Headless Compression Screw System (Depuy-Synthes, Raynham, Massachusetts) and had minimum 42 days of follow-up. Indications for surgery included nonunion from prior nonoperative treatment, fracture displacement of more than 1mm assessed by preoperative CT, proximal pole fractures and rarely, patient preference in cases of minimally displaced fractures.
Of the surgeries for non-union, 6 of 17 utilizing Synthes screws united for a mean time to union of 101 ± 43 days and 11 of the 28 utilizing Acutrak screws united for a mean of 153 ± 123 days. Of those who did not achieve radiographic union, 5 from the Synthes group and 2 of the Acutrak group were revised. Of the surgeries for acute fracture, 19 of the 28 utilizing Synthes screws united in 67 ± 40 days and 16 of the 28 utilizing Acutrak screws achieved union at 112 ± 121 days. Of those who did not achieve radiographic union, 3 from the Synthes group and 1 from the Acutrak group were revised. Indication for revision surgery in each of these cases was an ununited fracture at more than 6 months from index surgery. The odds of achieving union did not differ between the two hardware groups when controlling for confounders for both primary fixation (P=0.62) or non-union (P=0.92). The time to union was also not significantly different between the two groups for both primary fixation (P=0.53) or non-union (P=0.78).
Cohort demographics, fracture and surgery characteristics are listed in Tables 1 and 2. Many independent variables were excluded in our regression analysis due to collinearity. The independent variables included in our analysis are listed in Table 3. The full results of our regression analysis are listed in Table 4.

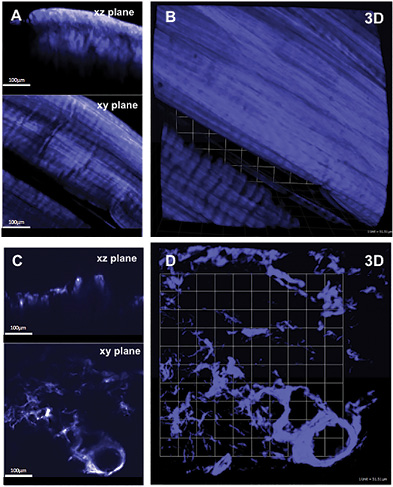
Representative 3D SHG images originating from fibrillar collagens in non-CNA versus CNA cases are shown in Figure 1. Left panel shows the sectional views, and the right panel shows 3D reconstruction representing a ~300µm thick tissue section. The emission spectrum obtained from the wavelength scan reveals a strong SHG signal manifested by a narrow peak at 440 nm, which is exactly one-half of the excitation wavelength (i.e. 880 nm). In CNA cases, the spatially resolved 3D SHG images showed relatively disorganized fibrillar collagens compared to the non-CNA control groups.

Quantification of Collagen Distributions in non-Charcot versus Charcot
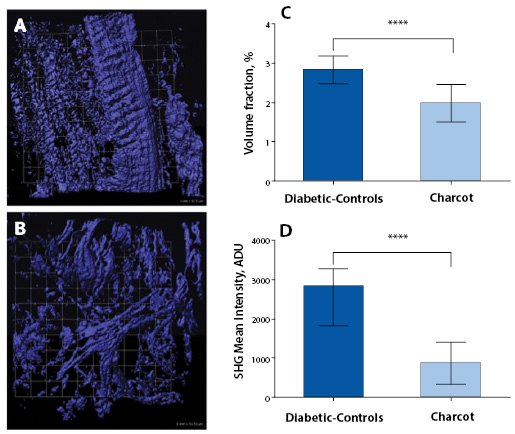
The statistical distributions and quantitative values obtained in the CNA compared to the non-CNA controls are illustrated in Figure 2. Representative SHG images of anisotropic collagen structures above the defined threshold values are characterized in Figure 2A-B. Figure 2C shows that the calculated collagen volume fraction is smaller in the CNA cases than in the non-CNA controls, indicating the destruction of fibrillar collagens in CNA cases (P<0.0001; Table 2). Of note, histograms show a region of overlap due to the heterogeneous nature of the tissues. The computed SHG mean intensity, which characterize the collagen fiber density and the degree of organization, denotes that collagen fibers in the sample studied are statistically more disorganized in CNA cases compared to non-CNA cases (P<0.0001; Table 2).

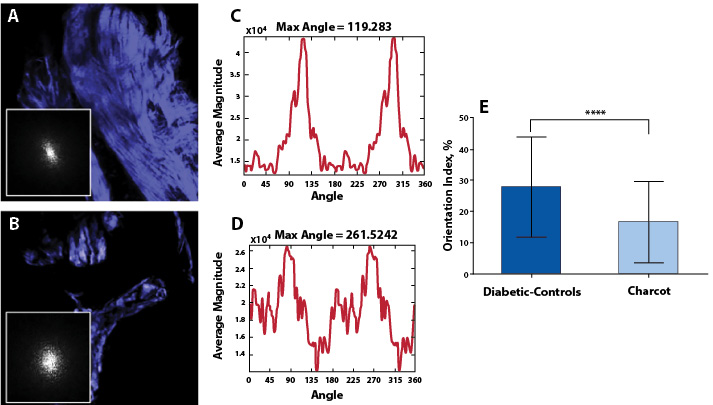
The results of Fourier analysis of SHG are summarized in Figure 3. The plot of power spectral density (Figure 3D) demonstrate that the high frequency components of SHG signal are condensed at multiple directions, indicating random arrangements of collagen fibers in CNA cases. The mean OI values of collagen fibers were found to be low, corresponding to less order, and their mean numerical values are found to be 16.50±13.04. In contrast, as evidenced from the plot of the power spectral density (Figure 3C), the collagen fibers favor an orientation in one direction rather than random in non-Charcot cases. The computed layer-by-layer OI values were found to be significantly greater (27.75±16.13). Thus, the high frequency component distributions as well as the fiber orientation properties were found to be relatively low in CNA cases compared to non-CNA cases (P<0.0001; Table 2).

Charcot neuroarthropathy (CNA) is a progressively destructive disorder which ultimately results in bone resorption and joint collapse. CNA has been reported to affect up to 5-10% of patients suffering from diabetic peripheral neuropathy, and the complications of collapse and deformity result in soft tissue compromise, ulceration, infection, and possibly amputation.19 Although formidable advances have been made in understanding the basic science and biochemical factors—including cytokine interactions, alterations in vascularity, and synovial changes—that may be relevant in the pathophysiology of CNA, the underlying mechanism of CNA and joint collapse remains uncertain. Type-I collagen accounts for >90% of organic matrix of bone and is a critical structural component of surrounding synovial tissue and fibrillar collagens. Yet, no study to date has evaluated the qualitative and quantitative properties of fibrillar collagens.20 This study is the first to report the changes in synovial tissue collagen in association with CNA when compared to diabetic neuropathic patients. Utilizing similar techniques previously described to provide spatially resolved 3D structural remodeling of collagen matrix with SHG microscopy, we assessed collagen in synovial tissue of patients with CNA and diabetic neuropathic patients without CNA.11,13 Statistically significant differences in collagen volume fraction (P<0.0001), collagen fiber density (P<0.0001), and collagen orientation index (P<0.0001) were found when comparing CNA synovial tissue to non-CNA diabetic controls (Table 2).
Previous studies have demonstrated the roles of altered cytokine expression within synovial tissue and osteoclastic bone resorption. Overexpression of cytokines involved in osteoclast regulation, such as IL-1, IL-6, and TNF-alpha, has been reported in immunohistiologic staining in patients with CNA.3 Likewise, Gough et al. demonstrated disproportionate activity of osteoclasts compared to osteoblasts in serum urine markers.10 Both studies provided insight into the pathophysiology of CAN, as the underlying component of the disease may be related to increased osteoclast activity leading to subsequent bony destruction and collapse.3,10
Alterations in vascularity have also been described in CNA. Edmonds et al. provided insight into the arterial blood flow of neuropathic diabetic feet by finding abnormal blood velocity profiles, increased diastolic blood flow, and increased arteriovenous shunting compared to diabetic controls without neuropathy.7 Blood flow abnormalities, in addition to the increased mechanical pressure on the soft tissues due to collapse, may also play a role in the characteristic wound breakdown seen in CNA.
Synovial changes in CNA have also been evaluated in a recent histologic and basic science investigation by Molligan et al. on the role of fibroblast-like synoviocytes (FLS).21 CNA synovial samples were compared to non-CNA controls with isolation of respective FLS for culture. FLS samples were cultured with tumor necrosis factor (TNF)-alpha and co-cultured with vasoactive intestinal peptide (VIP) and cartilage explants. Histologic samples of Charcot synovium were highly inflammatory, demonstrated increased expression of cadherin-11, and decreased innervation in comparison to non-CNA controls. When activated by TNF-alpha, isolated FLS from CNA synovium depleted proteoglycans from co-cultured cartilage, were more invasive, and had higher expression of ADAMTS4, IL-6, and RANKL. VIP interestingly neutralized the catabolic effect of Charcot FLS on co-cultured cartilage. This study not only emphasized the important role that synovium plays in CNA deformity but also identified potential targeted therapies to prevent or treat destructive processes.
This study is not without limitations. While this is a pilot study, one limitation is the relatively small sample size (n=4 CNA specimen, n=4 diabetic neuropathic control). The number of samples was limited by both patient/specimen availability as well as the labor intensiveness of surgical specimen harvest, preparation, and analysis. Furthermore, obtaining tissue from patients without CNA or diabetes as controls is impractical given the limited indications for lower extremity amputation in this patient population. With these details in mind, a prior power analysis demonstrated adequate power in this pilot study to detect statistically significant differences in the fibrillar collagen volume fraction, fiber density, and fiber orientation index.
In conclusion, the use of SHG microscopy demonstrated a statistically significant reduction in fibrillar collagen volume, fibrillar collagen density, and fibrillar collagen orientation in the CNA group when compared to the diabetic control group. The results of this study underscore an altered morphology of collagen in the synovium of Charcot patients compared to non-Charcot diabetic patients and represent an important initial step in the elucidation of the molecular mechanisms of Charcot arthropathy. Future efforts will be directed towards explaining the pathophysiology of the observed differences in this study in hopes to prevent the bone destruction and joint collapse seen in CNA.


