
Financial Payments for Lumbar Spine Surgery
Rui Wang, BA, Katiri Wagner, MS, Andrew P. White, MD, Kevin J. McGuire, MD, MS
Disclosure Information©2015 by The Orthopaedic Journal at Harvard Medical School
 PDF
PDFBACKGROUND In the past ten years, there have been significant increases in spending for lumbar fusions. A common assumption is that the current system incentivizes spine surgeons to perform more complex surgeries. Surgical interventions should ideally be chosen as appropriate for the patient. Our study assesses what financial incentive, as measured by professional revenues per operative time, exists for three common spine procedures.
METHODS This is a retrospective cohort study using administrative data from an academic orthopedic center. Billing records and aggregated operative time were reviewed for 611 patients from 2010-2012 who underwent an elective posterior lumbar laminectomy and fusion (PLF) (n=178), lumbar laminectomy (L) alone (n=136), or a lumbar microdiscectomy (MD) (n=170).
RESULTS Analysis showed that the mean total professional revenue for PLF is higher than for L, which is higher than that for MD (p<0.001). However, mean professional compensation per total operative time for MD is higher than that for L, which is higher than that for PLF (p<0.001). Unadjusted for time, professional compensation was a better predictor (p=0.001) of the number of procedures than compensation per operative time (p=0.321).
CONCLUSION We found that there is actually a significant financial disincentive to performing more complex lumbar procedures once professional compensation is adjusted by the time needed for each procedure. Our study supports previous studies in other locations in U.S. These studies suggest that adjusted for surgical time, the increase in more complex spine procedures is not necessarily driven by surgeons’ financial payments.
There has been a 500% increase in Medicare spending for lumbar fusions in ten years, accompanying a greatly increased rate of fusion procedures.1 Studies on the clinical benefits of surgery for lumbar spinal stenosis and for the type of procedure selected have both been mixed.1-15 A commonly held assumption, found in the lay press and the literature, has been that the current system incentivizes spine surgeons to perform more complex surgeries.16,17 This is especially pertinent given the re-evaluation of compensation models in the state of Massachusetts and throughout the United States following the passage of the Patient Protection and Affordable Care Act in 2010. Policies built around an incorrect assumption of how financial payments influence surgeon decisions regarding treatment for lumbar spinal stenosis may not be effective and may lead to unintended consequences.
Financial payments driving physicians’ treatment choices and behavior have been studied under various settings. Data from a survey of physician visits show that physicians spend less time with their capitated patients than with their non-capitated patients.18 There has been extensive evidence linking increased utilization to the fee-for-service payment system.19 Explicit incentives that place physicians at financial risk appear effective in reducing utilization, but the effectiveness of bonus payments is mixed.20
Studies that take into account operation time when analyzing financial payments include one where total care time for each procedure and physician fees were used to calculate procedure-specific professional revenues, which found that professional revenues for endovascular repair were much higher per unit time than that of open repair of similar conditions.21 A retrospective cohort study reported a hospital revenue-analysis comparing lumbar total disc replacement (TDR) to spinal fusion. Patients with 1-level disease had significant differences, with the fusion group having more expensive procedures, blood loss, and operating room time. Patients with 2-level disease had similar total revenues, but longer operative time for fusion.22 A retrospective study similar to our present study compared single-level decompression with combined decompression and instrumented fusion as performed by a single surgeon.23 After assessing the reimbursement amount per time expenditure, where total time encompassed surgical time and number and duration of post-operative visits, the authors concluded that the monetary incentives did not align with more fusion procedures.
Our study seeks to quantify existing financial payments, operationalized as professional revenues per unit time, for three common spine procedures, and to determine whether surgeons’ behaviors are consistent with financial compensation. Aggregated billing data were used to evaluate whether monetary payments might drive spinal surgeon’s procedural choices. We hypothesized that although some procedures have higher professional revenues, once the corresponding longer times required to perform these procedures are accounted for, surgeon behaviors do not correspond to the marginal financial compensation.
De-identified data was provided by the billing department for this analysis. Billing records for professional revenues and aggregated operative time were reviewed from the period 1/1/2010 through 1/31/2012. Over the 2-year period referenced, this urban academic spine center reported 65,446 total RVUs, with revenue from both public and more than 10 private payers. Public payers, including Medicaid, Medicare, Medicare Replacement, and Workers Comp & Motor Vehicle Accidents, made up 41.1% of the total RVUs and 40.3% of the total revenues.
Current Procedural Terminology (CPT) codes (set of codes maintained by the American Medical Association that describes medical services for administrative and analytical purposes) were used to identify 611 patients who underwent spinal surgery. Following individual case review, 484 patient cases were identified to be elective posterior lumbar laminectomy and fusion (PLF) (n=178), lumbar laminectomy (L) alone (n=136), or lumbar microdiscectomy (MD) (n=170). Lumbar microdiscectomy involves removal of a portion of damaged disc material. Lumbar laminectomy involves removal of the lamina. Posterior lumbar laminectomy and fusion involves adding bone graft to the spine following removal of the lamina. Mean total professional revenues, mean professional revenues per OR minute, and number of procedures were used as the outcome measures. Descriptive statistics, analysis of variance (ANOVA) analyses with regressions, and ordinary least squares (OLS) regressions were performed using Stata 12, and were reported as appropriate and the level of significance was set at p<0.05.
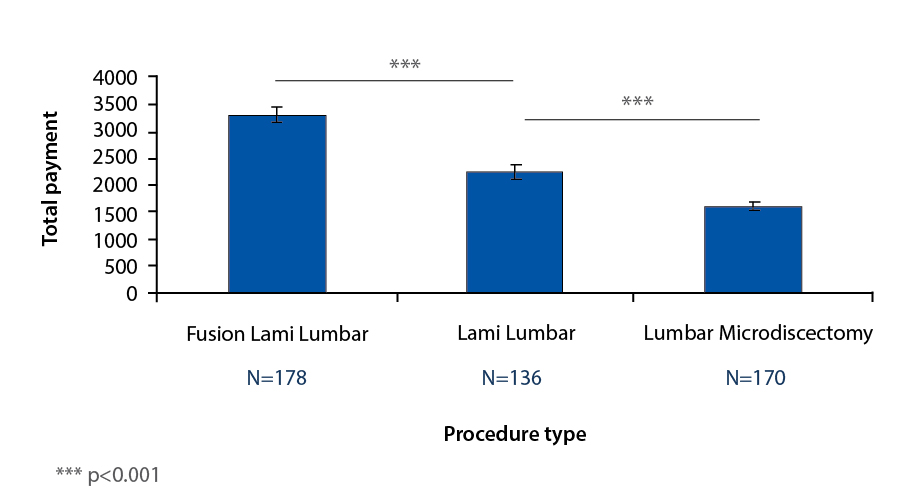
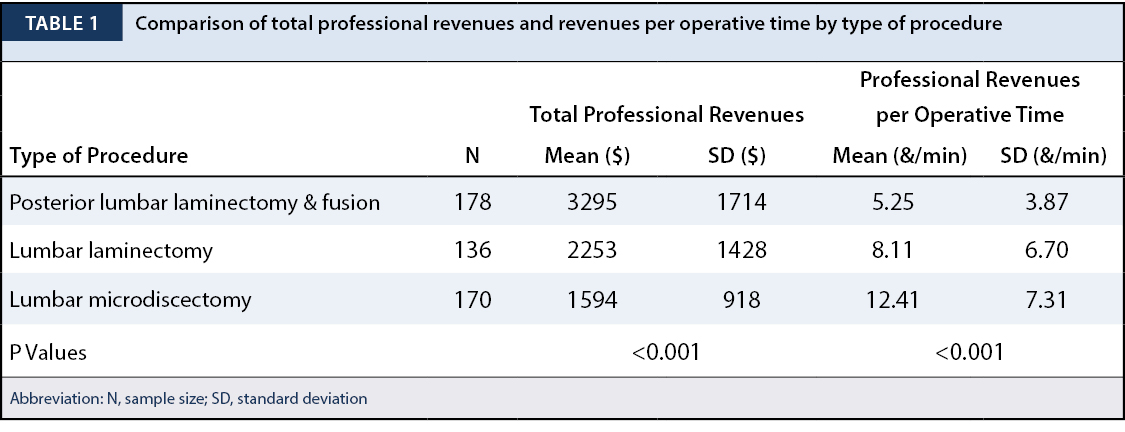
Total professional revenues for posterior lumbar laminectomy and fusion had a mean of $3295 and standard deviation of $1714 (Table 1). Total professional revenues for lumbar laminectomy had a mean of mean of $2253 and standard deviation of $1428. Total professional revenues for lumbar microdiscectomy ranged had a mean of $1594 and standard deviation of $918. Professional revenues per operative time for posterior lumbar laminectomy and fusion had a mean of $5.25/min and standard deviation of $3.87/min. Professional revenues per operative time for lumbar laminectomy ranged from had a mean of $8.11/min and standard deviation of $6.70/min. Professional revenues per operative time for lumbar microdiscectomy had a mean of $12.41/min and standard deviation of $7.31/min. There is not a statistically significant difference between the providers in their mean professional revenues per operative time for these three procedures.
ANOVA analysis showed the mean total professional revenue for a posterior lumbar laminectomy and fusion is higher than for lumbar laminectomy, which is higher than that for lumbar microdiscectomy (p<0.001) (Table 1); in summary, total professional revenue for procedure is PLF>L>MD (Figure 1).
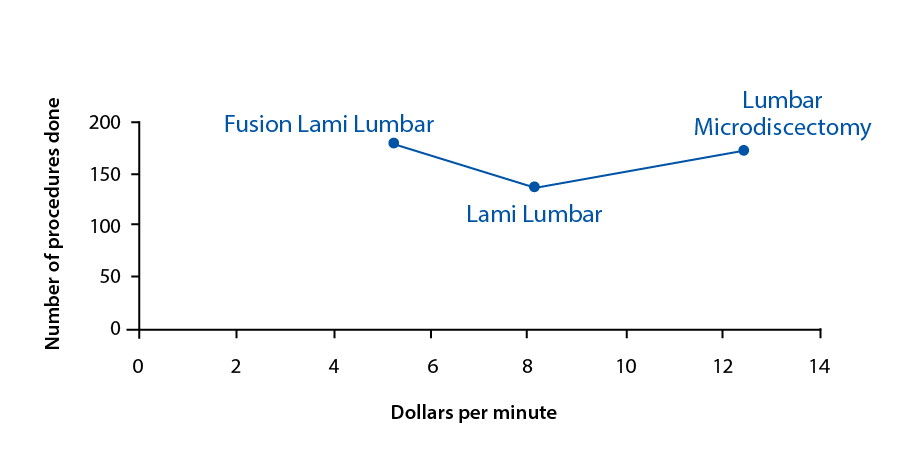
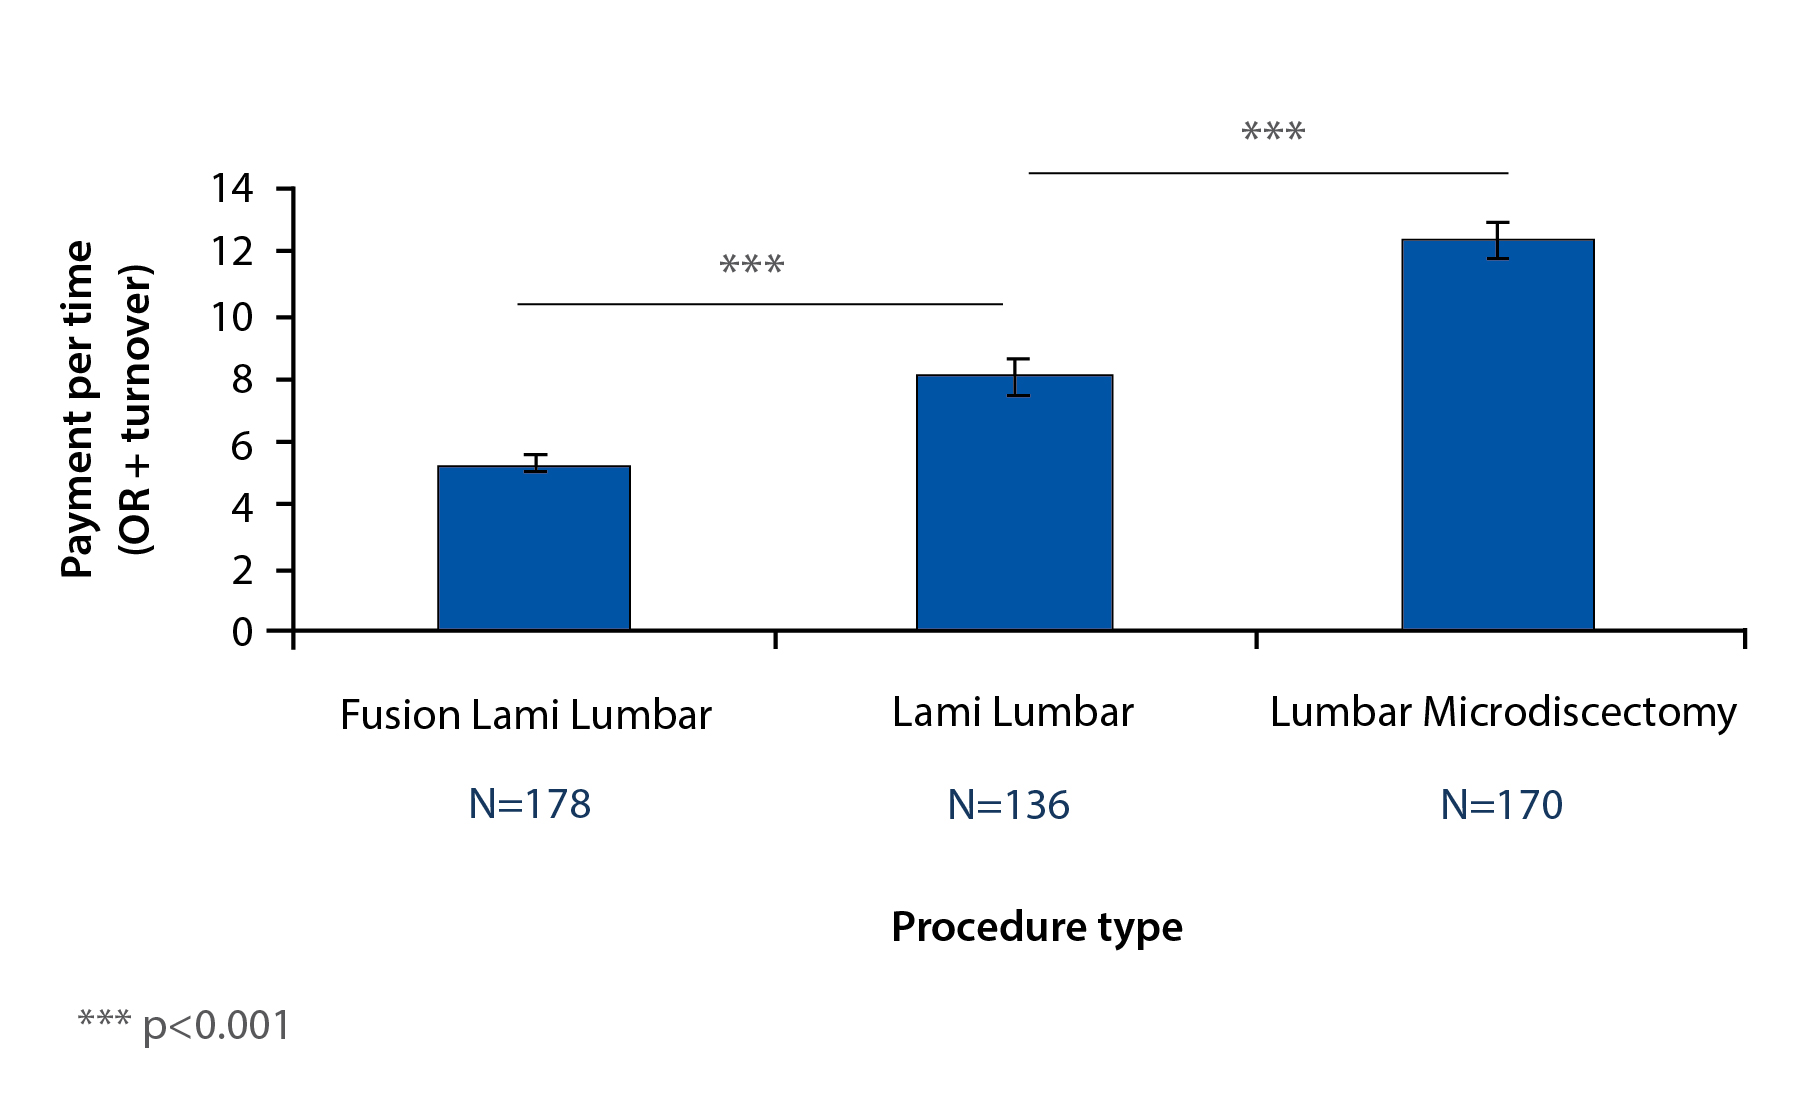
However, mean professional compensation per total operative time for lumbar microdiscectomy is higher than that for lumbar laminectomy, which is higher than that for posterior lumbar laminectomy and fusion (p<0.001) (Table 1); in summary, professional revenue/time necessary for procedure is MD>L>PLF (Figure 2).

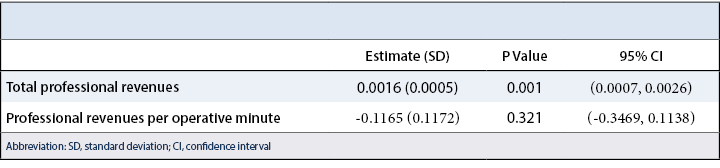
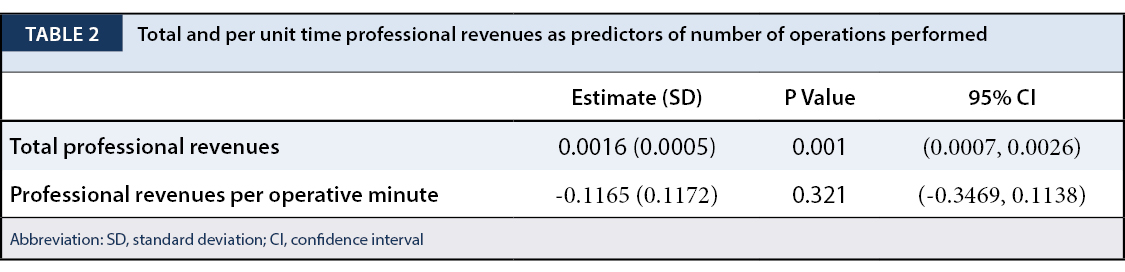
Unadjusted for time, professional compensation was a better predictor (p=0.001) of the number of procedures done for each type of procedure than compensation per operative time (p=0.321) (Table 2, Figure 3).
The US has the highest rate of spine surgery in the world, with wider geographic variations than many other procedures. Medicare data for 2001 shows 6-fold variations in spine surgery rates among US cities, and 10-fold variations in spine fusion rates. Spinal fusion procedures tripled during the 1990s, but rates of repeat surgery after fusion were no lower than the rates after decompression alone.24 A review of the literature found that compared to lumbar discectomy, fusion procedures are increasing rapidly and vary markedly among surgeons, geographic regions, and between the US and England, suggesting differences in opinion regarding indications for lumbar fusion. Fusion for spinal stenosis with spondylolisthesis is associated with higher costs and complication rates than is decompressive surgery.25 Lumbar fusion rates rose more rapidly in the 90s than in the 80s and the increases were much greater than those in other major orthopedic procedures. However, reports of clarified indications or improved efficacy are still lacking.26 Between the 90s and 2000s, overall utilization for cervical, thoracolumbar, and lumbar fusions have all increased, but lumbar fusions have increased by far the most.27 In ten years, there was a more than 500% increase in Medicare spending for lumbar fusions. The rate of procedures within a region is stable, and rates were not correlated with per-capita supply of orthopedic and neurosurgeons.1 While overall surgical rates for stenosis operations declined from 2002 to 2007, more complex fusion procedures increased 15-fold.28 Some suggest that the “market of the spine surgery” is growing because patients are demanding solutions for their back problems, and often choose spinal fusions.29,30 A New York Times article in 2003 suggests that surgeons are responding to monetary incentives, with Medicare paying up to 4 times more for instrumented fusion than for laminectomy, and companies producing internal fixation devices offering economic rewards.16
The present study shows that from a total professional revenues perspective, posterior laminectomy and fusion appears to generate more revenue than lumbar laminectomy alone, which is more than lumbar microdiscotomy. After accounting for the amount of time required for each type of procedure, however, the reverse trend is seen. Our study does have limitations. Some patients undergoing PLF may have conditions that would not be indications for simpler procedures, however, the authors are interested in addressing the concern that spine surgeons, when presented with a case where the type of procedure may be considered surgeon choice, have an incentive to choose the more complex procedure. Our study suggests that in fact, if time is taken into account, there is a financial disincentive to perform the more complex procedure. The study also assumes that patient volume is not limiting and that rather operative time is limiting. Our study does not account for post-operative care. However, if the post-operative course including hospital inpatient stay and follow-up appointments in terms of number of visits were included in this analysis as it has been elsewhere, the “simpler” procedures would appear even more advantageous compared to the more complex ones as they have a shorter hospital stay (less rounding on the patient) and fewer follow-up appointments. Our study does not take into account who sees the patients and what services are owned or not owned by the practice. It is solely based on surgical revenue.
Our study presents data from a specific practice with a unique and changing payer mix. Though we are not able to include payer mix variability as part of our analysis, certainly differences in payer mix may also change the compensation rates and therefore the results. This study in theory also assumes that surgeons can determine their own case mix. The authors believe this is indeed true. There is enough variability in opinion as to what is surgically necessary to obtain a good result. Although our study focuses on provider payments, because hospitals are paid by DRG (diagnosis-related group, which accounts for diagnoses, procedures, age, sex, discharge status, and the presence of complications or comorbidities), PLF procedures do provide a relative increase in reimbursement to the hospital, which may bring the institution greater net margin and resources. This may serve as an unmeasured financial incentive for surgeons in our study.
In our analysis of academic spinal surgeons, there appears to be a significant financial disincentive to performing relatively more complex lumbar procedures if adjusted for surgical time. This suggests that despite the financial disincentive, spinal surgeons are increasingly making the right decision for the patient in choosing the type of lumbar spine surgery. Our study supports previous studies performed throughout other locations in the U.S. These studies call into question the assumption that financial compensation has driven the increase in more complex spine procedures.
We thank Mr. Philip Schrodel, CEO of Physicians Professional Services at BIDMC, for billing data acquisition.


